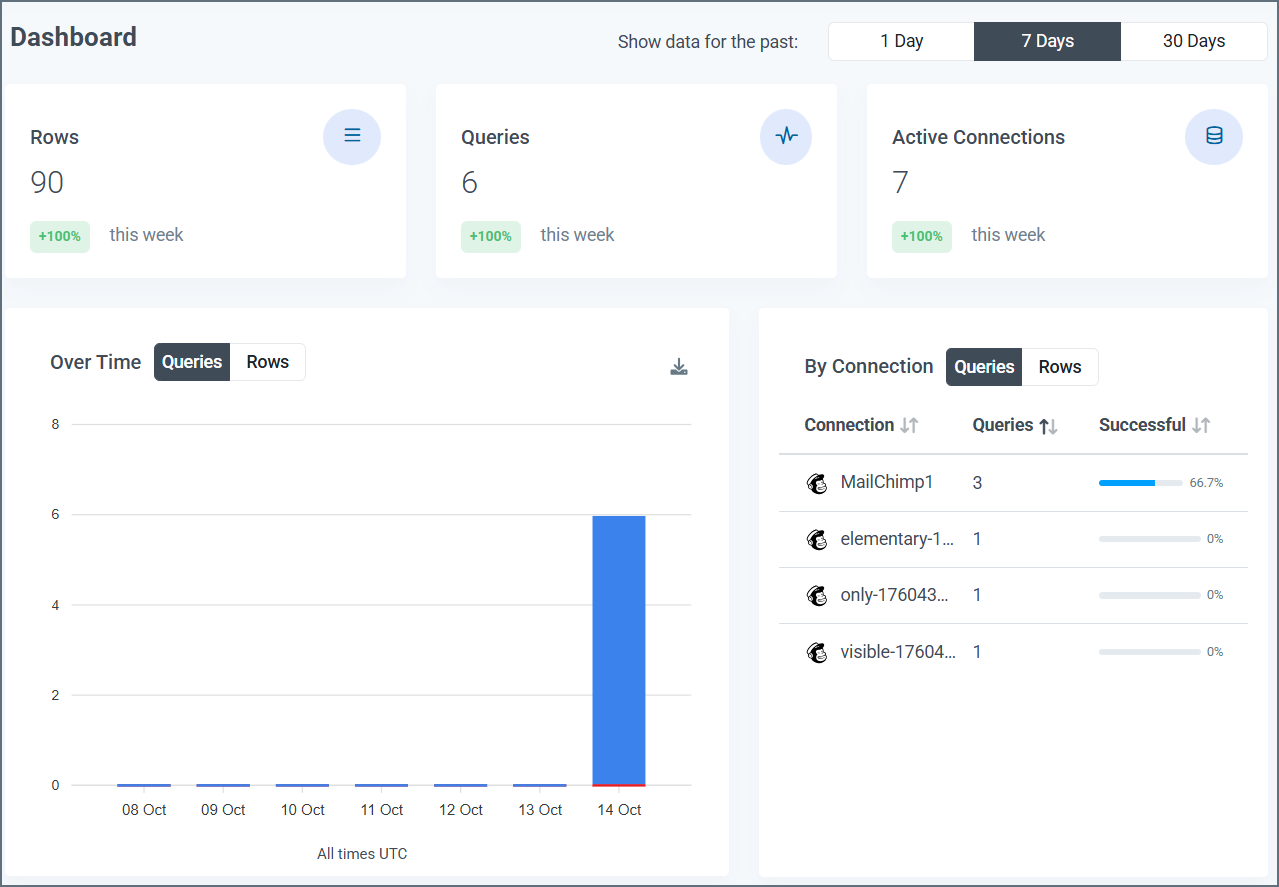
Information Boxes
Information boxes at the top of the page display the quantity for each of these four categories in the selected time period:- Rows: The rows that are processed
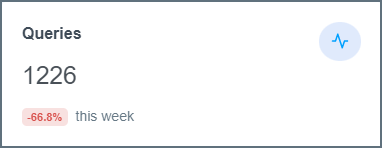
- Queries: The queries that are performed
- Active Connections: The active connections on your account
Data Visuals
Under the information boxes, the Dashboard page displays two visuals:- Queries/Rows Over Time
- Queries/Rows by Connection
Queries/Rows Over Time
This bar graph shows the total number of queries or total rows returned in the child account over the selected time period. The x-axis displays the dates, and the y-axis displays the number of queries/rows.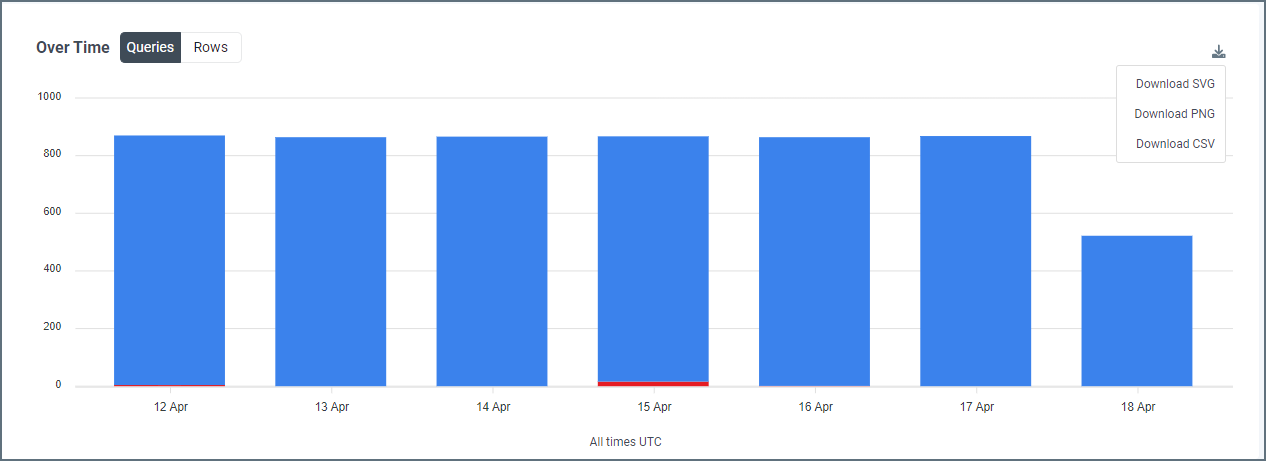
- The number of successful queries or rows returned, displayed top portion of the bar and colored blue
- The number of failed queries, displayed as the bottom portion of the bar and colored red
Queries/Rows by Connection
This table displays the number of queries or total rows by each connection in the selected time period.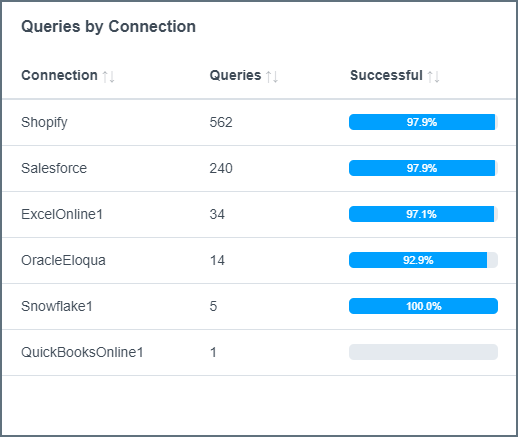
- Connection: The name that is given to the connection on the Connections tab
- Queries: The total number of queries, both successful and failed, that are made by the connection in the selected time period
- Successful: The percentage of queries from the connector that succeed in the selected time period